Statistic
This extension shows statistic about products searching by taxonomies and their combinations, good for shop admin to see what about users looking more in the shop
Installation
- Create new database for the statistic only
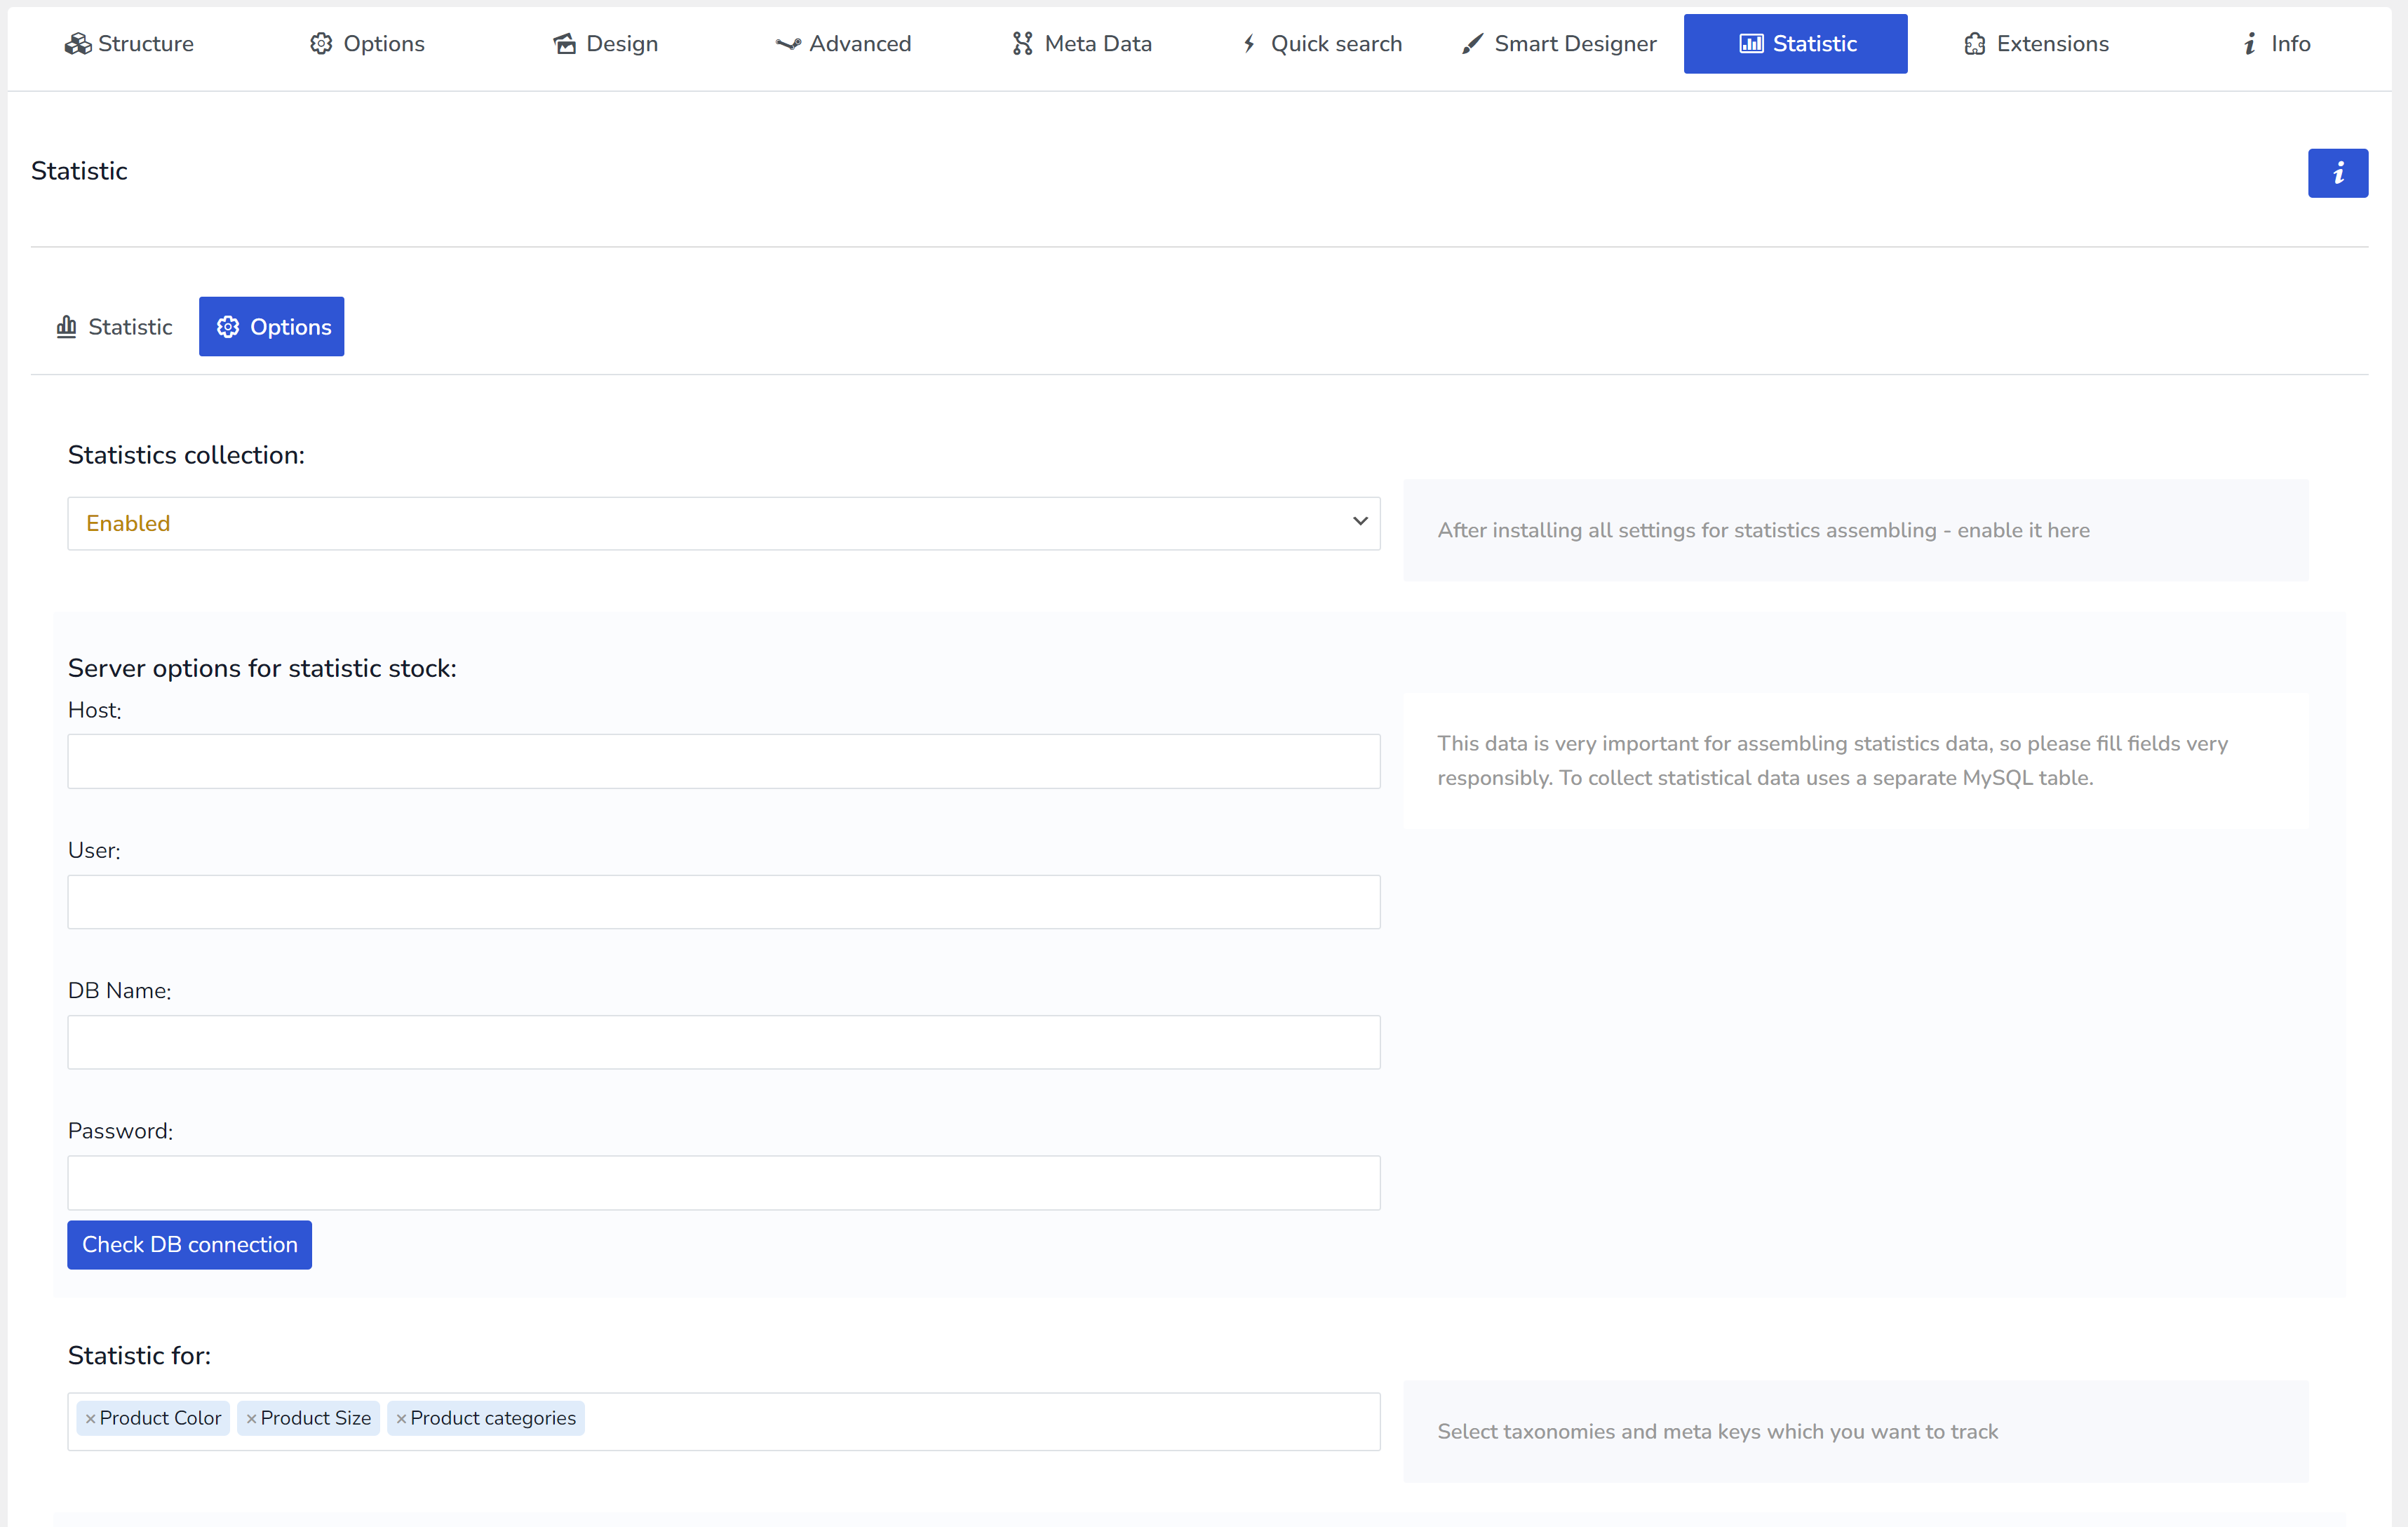
- In the tab Options of the Statistic fill up the data for “Server options for statistic stock“
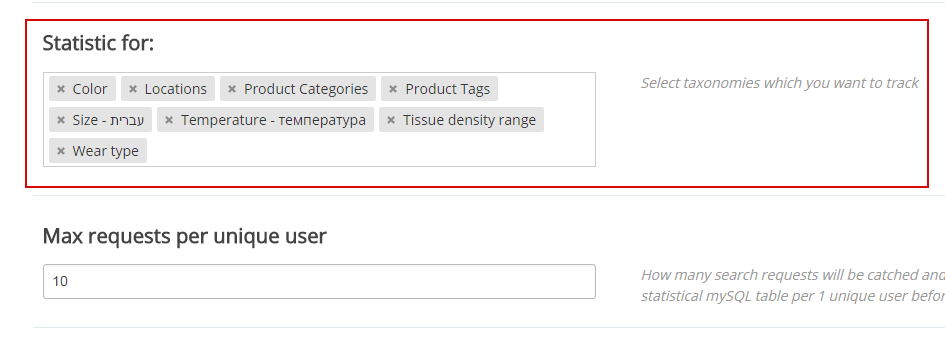
- In “Statistic for” select taxonomies which you want to track
- Set “WordPress Cron period” to 12 hours or any other time period you want
- Select “Enabled” for “Statistics collection” option
That is all. Statistic data will be placed in the special tmp MySQL table, then will be treated, and then by cron data will be moved into the main statistical DB.
Using
- After some days of statistic data assembling or more you can start to analyze the data
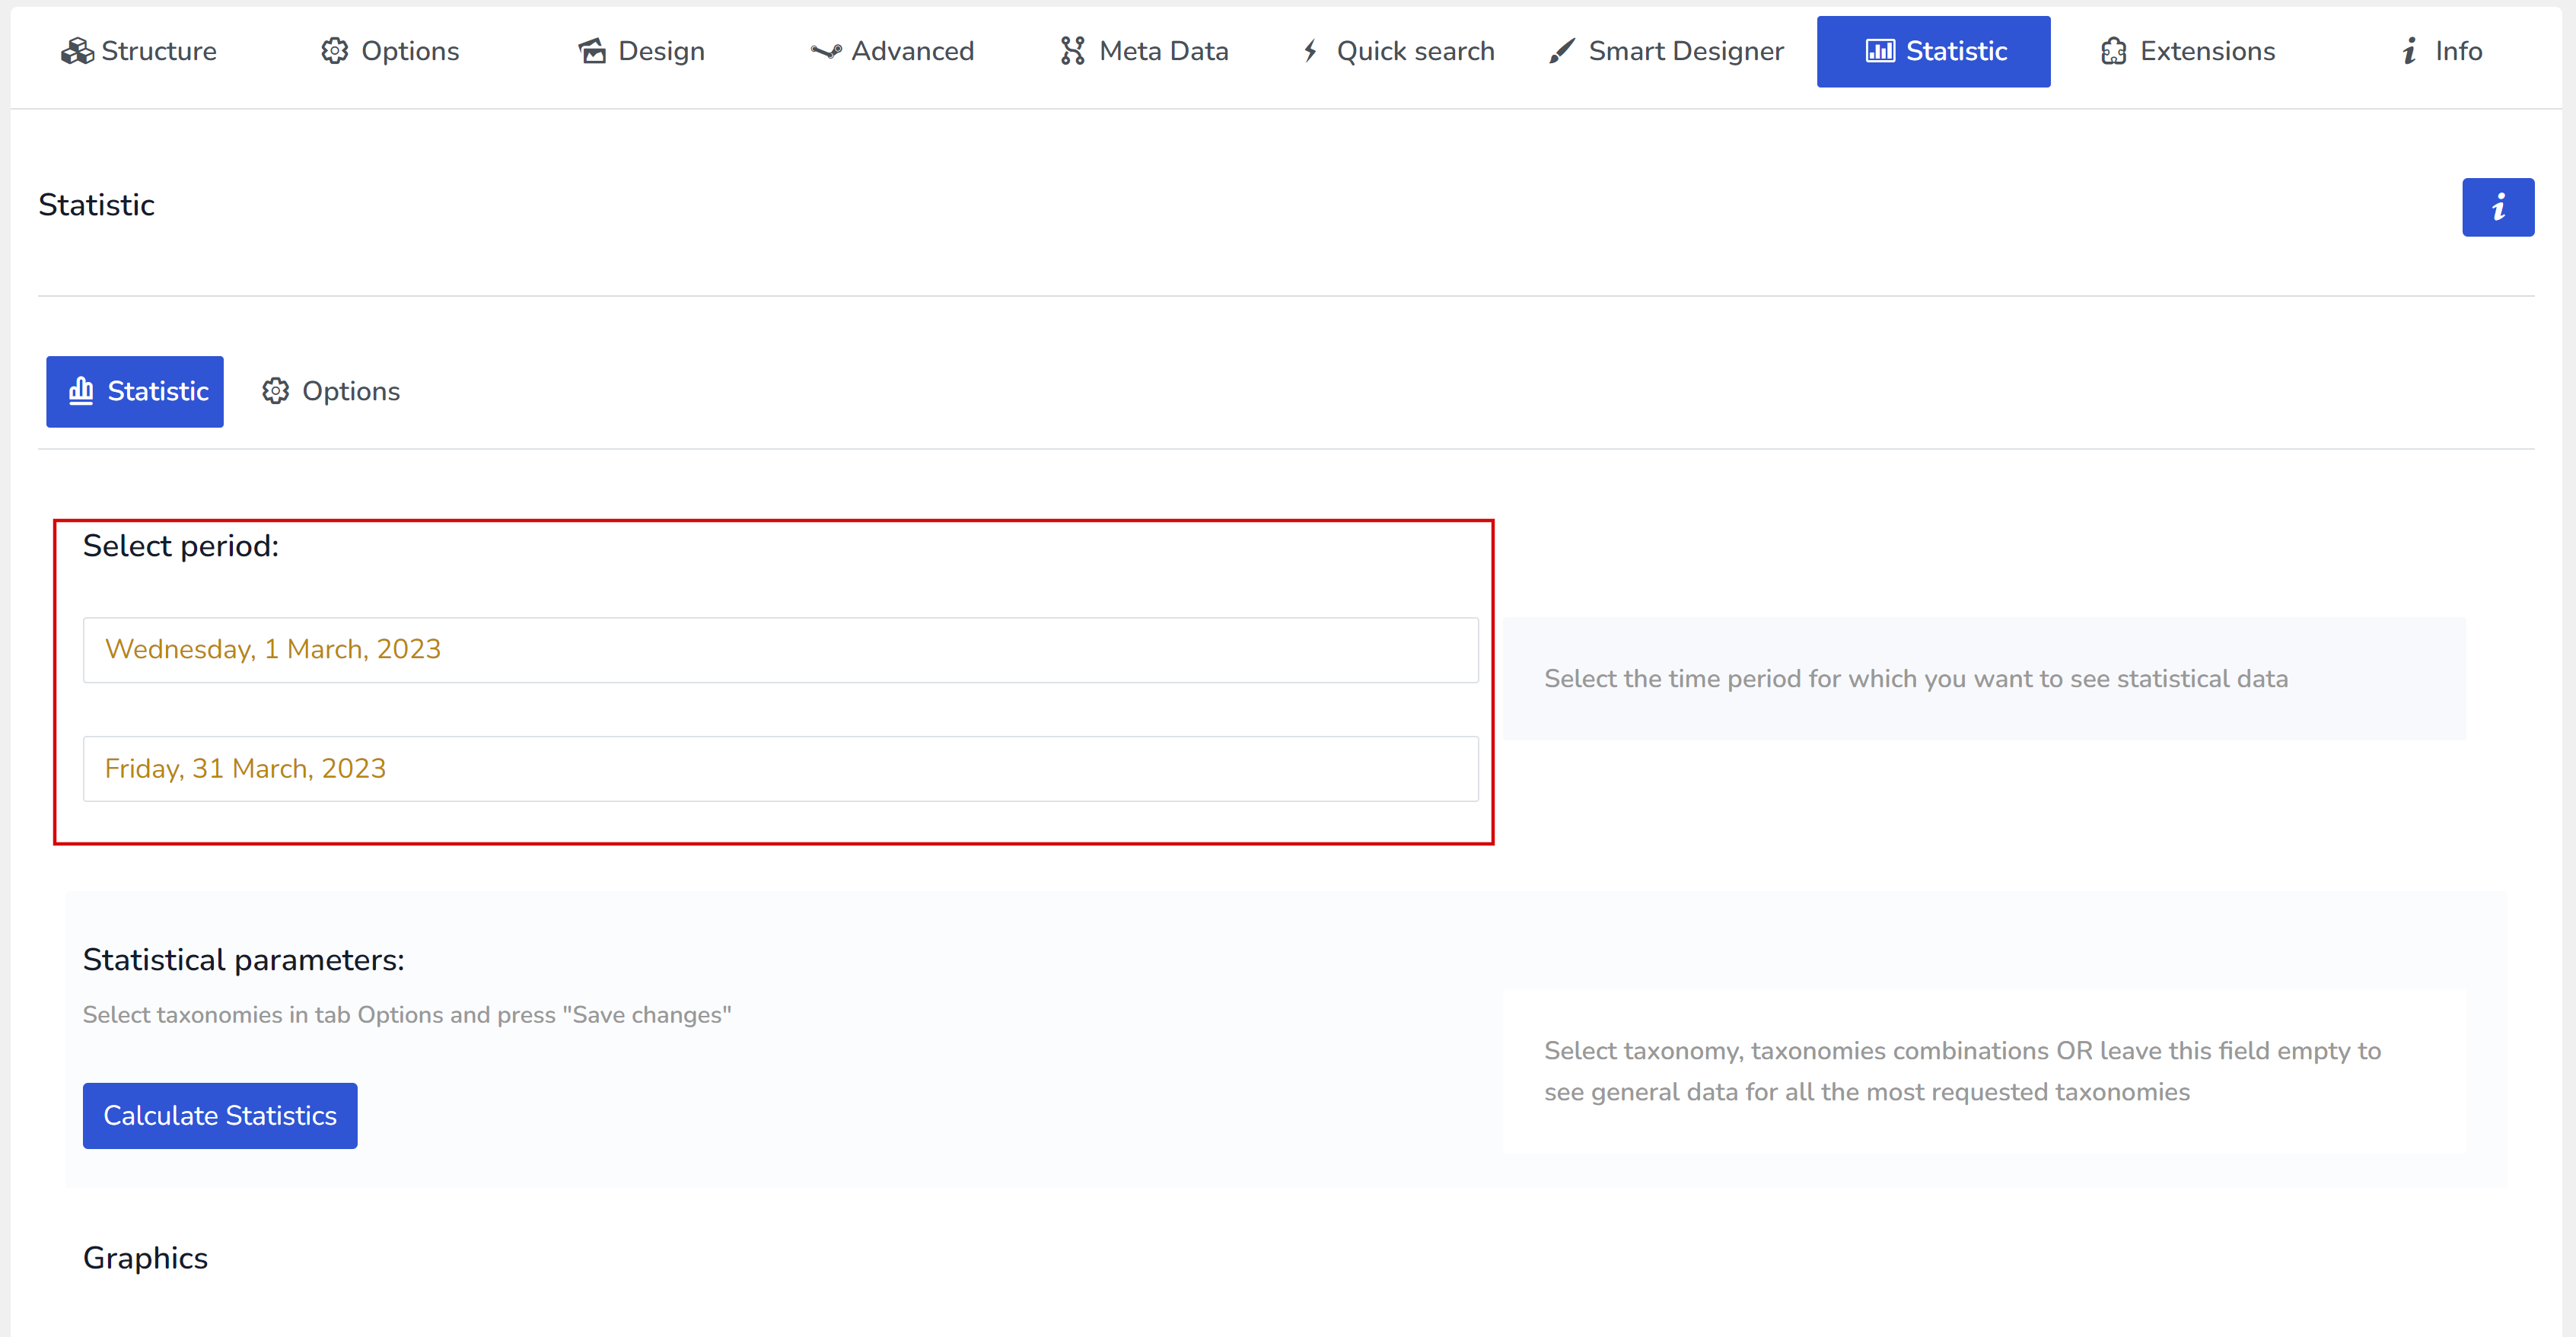
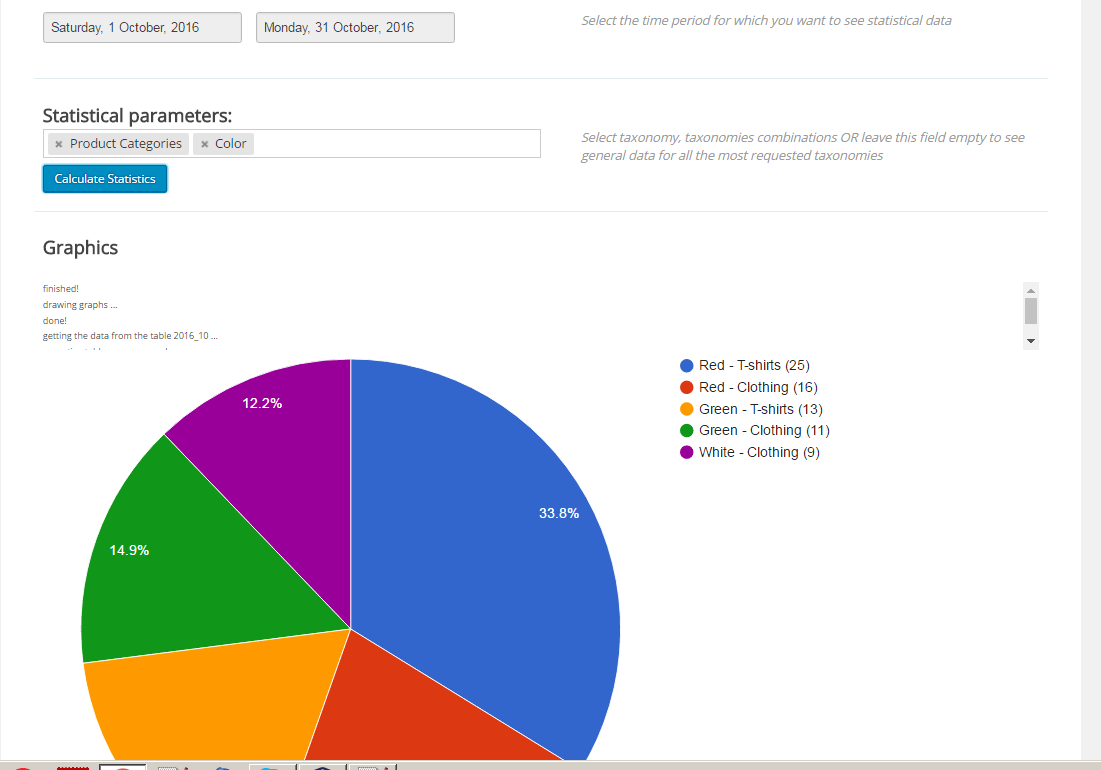
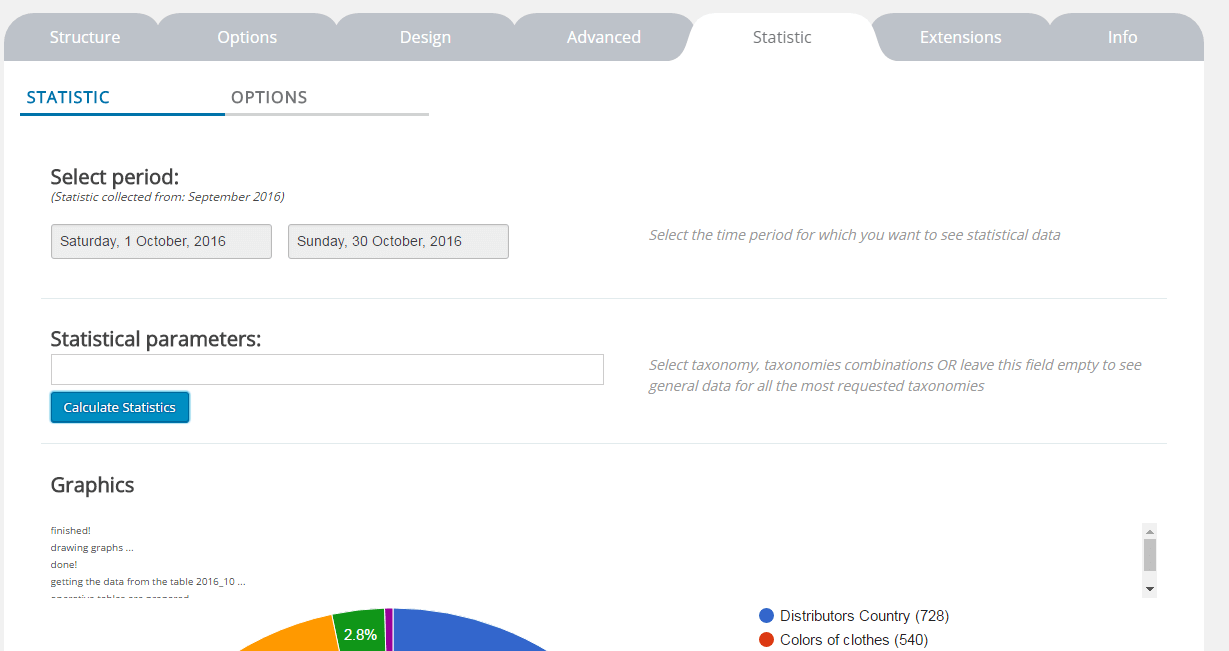
- Select period of the date
- Press the button “Calculate Statistics“
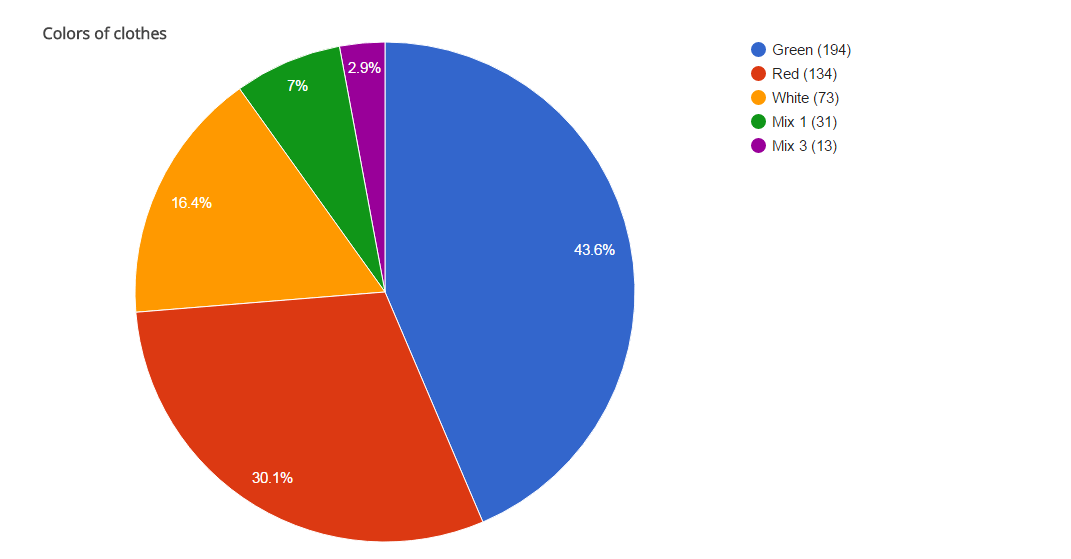
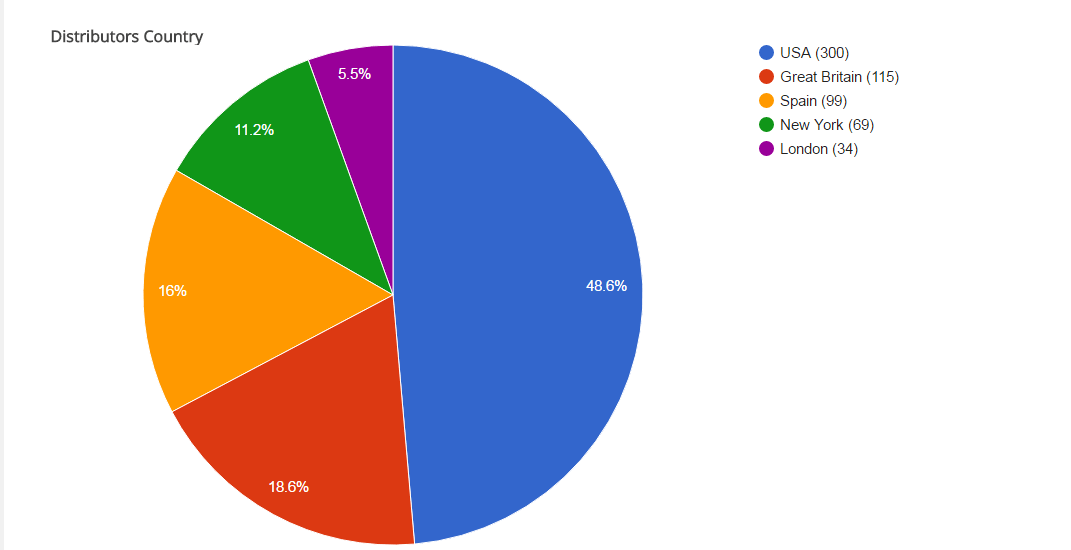
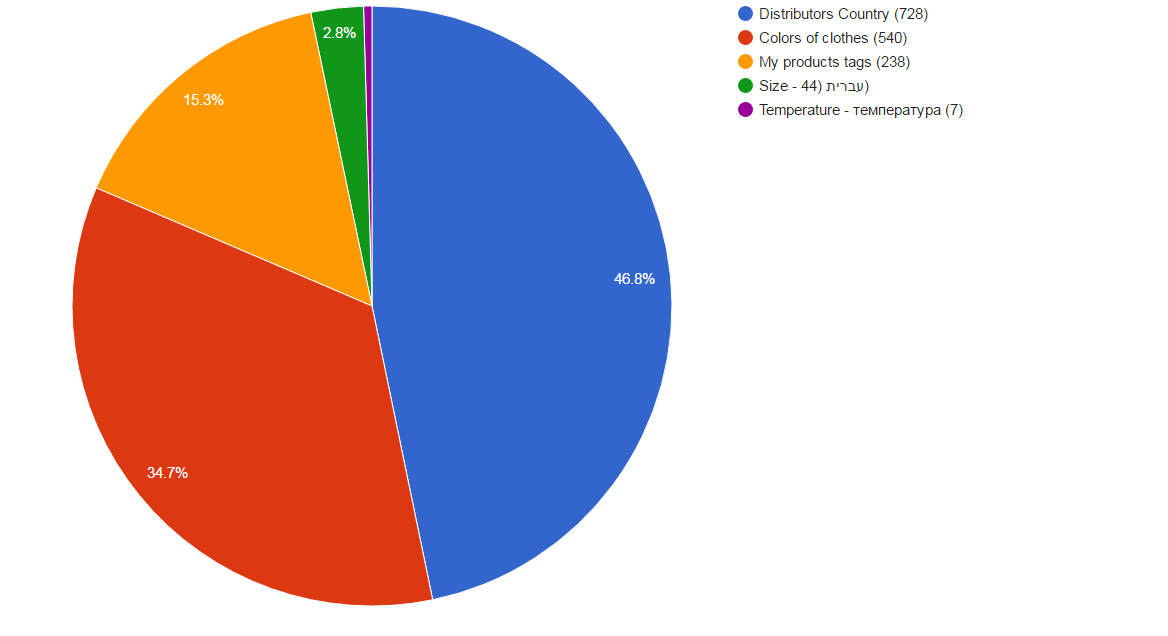
- If to leave option “Statistical parameters” empty will be shown all statistic data for all selected in “Statistic for:” taxonomies in the first graph and below of it will be shown statistic data graphs for all selected taxonomies terms
- If to select any taxonomies in the “Statistical parameters” field – will be shown statistic data for the selected taxonomies terms
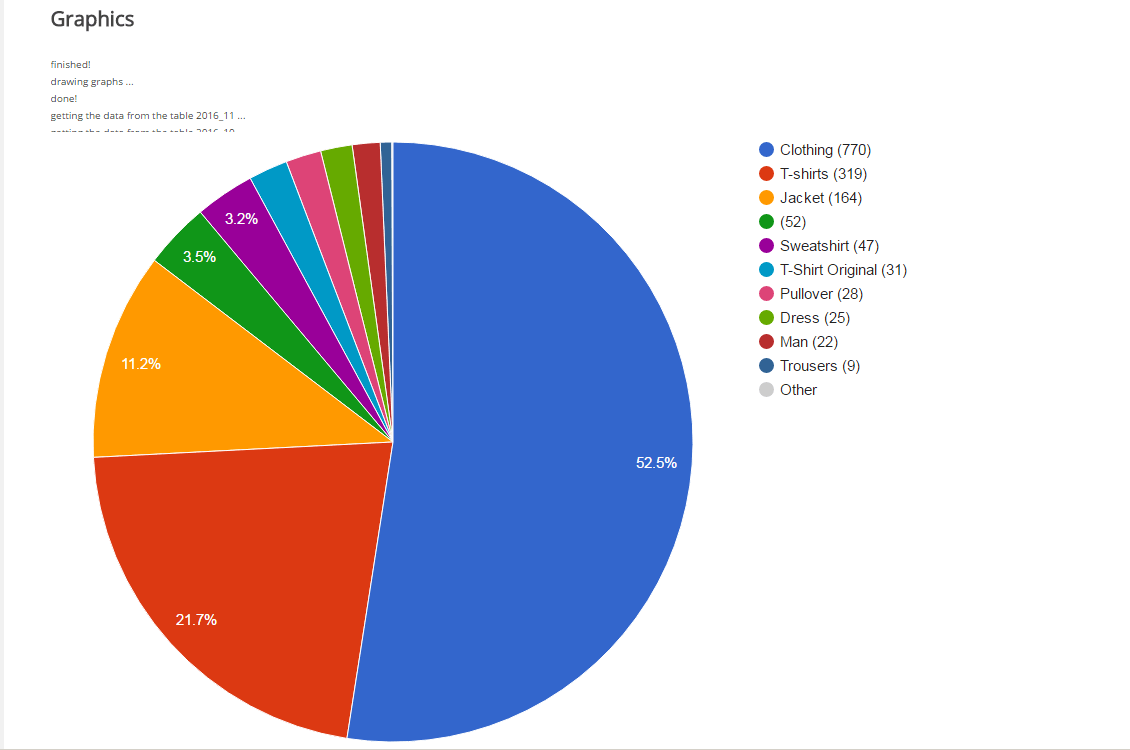
- Example 1: in the “Statistical parameters” selected only one taxonomy “Products Category” – will be shown the most popular terms of this taxonomy ordered by popularity (count of requests)
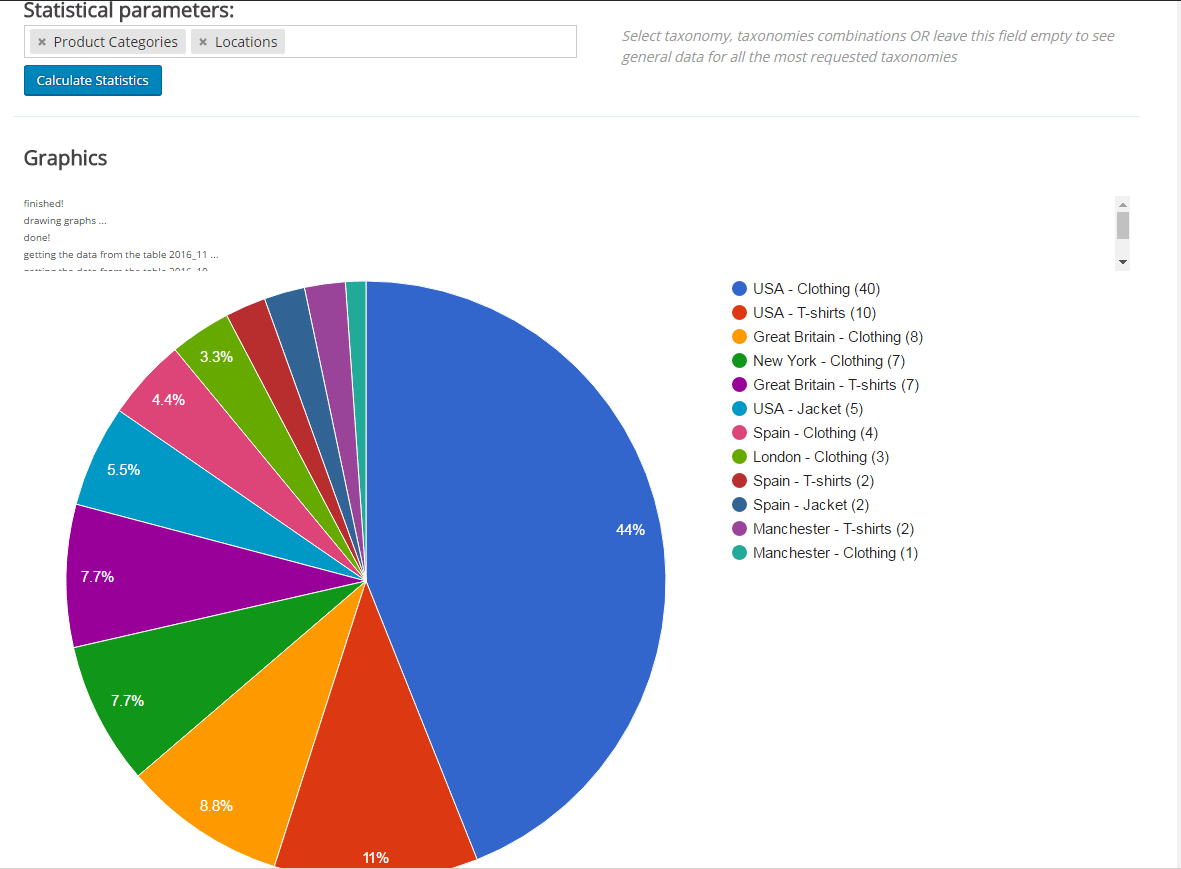
- Example 2: in the “Statistical parameters” selected taxonomies “Products Category” AND “Locations” – will be shown on the graph all (see “Max terms or taxonomies per graph“) terms variations ordered by popularity (count of requests)
Has its own options:
- Max requests per unique user – how many search requests will be catched and written down into the statistical MySQL table per 1 unique user before cron will assemble the data
- Max deep of the search request – how many taxonomies per one search request will be written down into the statistical MySQL table for 1 unique user. The excess data will be truncated! Number 5 is recommended. More depth – more space in the Database will be occupied by the data
- How to assemble statistic – use WordPress Cron if your site has a lot of traffic, and external cron if the site traffic is not big. External cron is more predictable with time of execution, but additional knowledge how to set it correctly is required
- Max terms or taxonomies per graph – how many taxonomies and terms to show on the graphs. Use no more than 10 to understand situation with statistical data